Sources
Official pages, opened on 18 November 2026.
CPC, the Met Office and WMO, with file captions kept distinct.
Every official figure on this site was checked against the pages below on 18 November 2026. Wikipedia was not used as a source. File captions are quoted as captions, not as a silent rewrite of those pages. Climate.gov was opened, found to be an archived snapshot as of 25 June 2025, and was not used as current status.
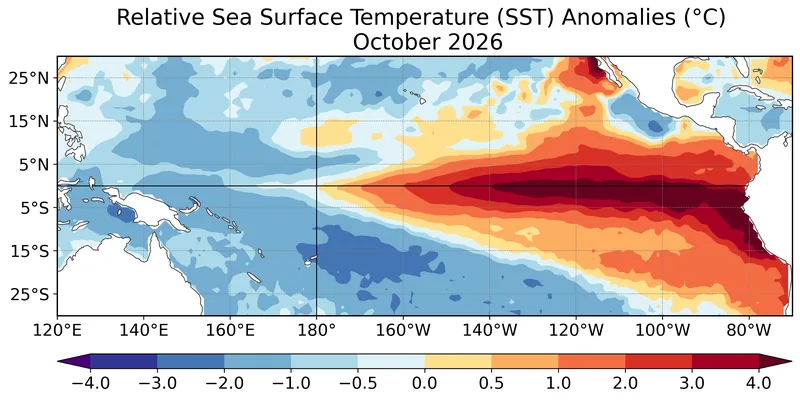
- NOAA CPC ENSO Diagnostic Discussion, 12 November 2026 — The current El Niño Advisory, Niño indices, historic-event language, and Figures 1–8. Opened and saved on 18 November 2026.
- The same discussion, plain text — Opened so the wording could be quoted without the HTML layout. Opened and saved on 18 November 2026.
- NOAA CPC Official RONI Outlook, November 2026 — Official forecasts verified using RONI; 1991–2020 base period; caution on large values. Opened and saved on 18 November 2026.
- NOAA CPC Oceanic Niño Index v6 — Historical ±0.5 °C / five overlapping seasons rule, and the PIS 26-05 note that RONI is now official. Opened and saved on 18 November 2026.
- NOAA CPC ENSO FAQ — The 3-month 0.5 °C onset wording, and “every 3 to 5 years or so” for La Niña. Opened and saved on 18 November 2026.
- Met Office, El Niño, La Niña and the ENSO description — Definitions, Niño3.4, the “about 0.5 °C for several months” guide, typical length. Opened and saved on 18 November 2026.
- Met Office, seasonal forecasts and climate drivers — UK winter risks, global chances, and the storm-basin wording. Opened and saved on 18 November 2026.
- WMO El Niño/La Niña Update, August 2026 — Mid-August status, dated 3 September 2026, including the strength-and-impacts caution. Opened and saved on 18 November 2026.
- WMO, El Niño / La Niña phenomena — The working theme page; a guessed /topics/ path returned 404 and was not used. Opened and saved on 18 November 2026.
Enjoyed a dated official advisory, unblended thresholds, and a careful look at chances rather than guarantees?
No pop-ups. No intrusive advertising. Just interesting stuff. A little support helps the next climates.im site get built.