Explore climates.im

El Niño

El Niño

An El Niño Advisory issued 12 November 2026, kept dated, with earlier official updates left on their own cards.
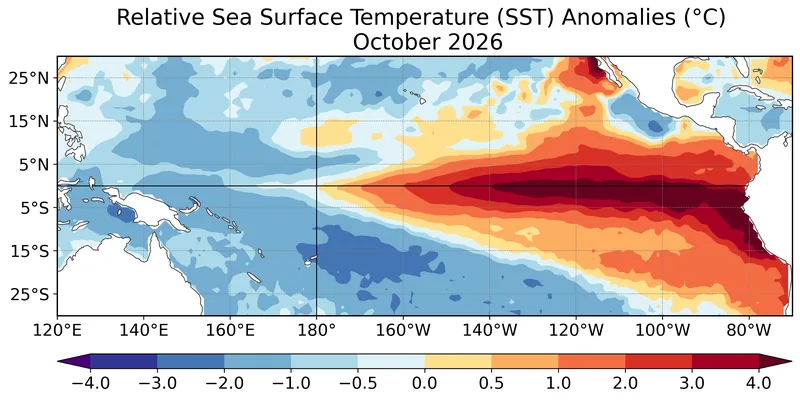
Map of average relative sea-surface temperature anomalies for October 2026, with strong warmth along the eastern equatorial Pacific.
Figure 1 from the CPC/NCEP/NWS ENSO Diagnostic Discussion issued 12 November 2026: average relative sea surface temperature (SST) anomalies (°C) for October 2026, computed with respect to the 1991–2020 base period monthly means. Data: OISSTv2.1. Official map: NOAA Climate Prediction Center / NCEP / NWS · Public domain (United States government work) · NOAA Climate Prediction Center / NCEP / National Weather Service

An official status, dated

The Climate Prediction Center / NCEP / NWS ENSO Diagnostic Discussion issued 12 November 2026 is an El Niño Advisory. “El Niño continues to strengthen, with a strong-to-very strong El Niño likely through January-March 2027 (remaining greater than a 79% chance).” [source] October 2026 relative sea-surface temperature anomalies exceeded 4.0°C, extending farther westward across the eastern equatorial Pacific. The Niño indices reached +2.5°C in Niño-3.4, +3.6°C in Niño-3, and +4.4°C in Niño-1+2. [source]
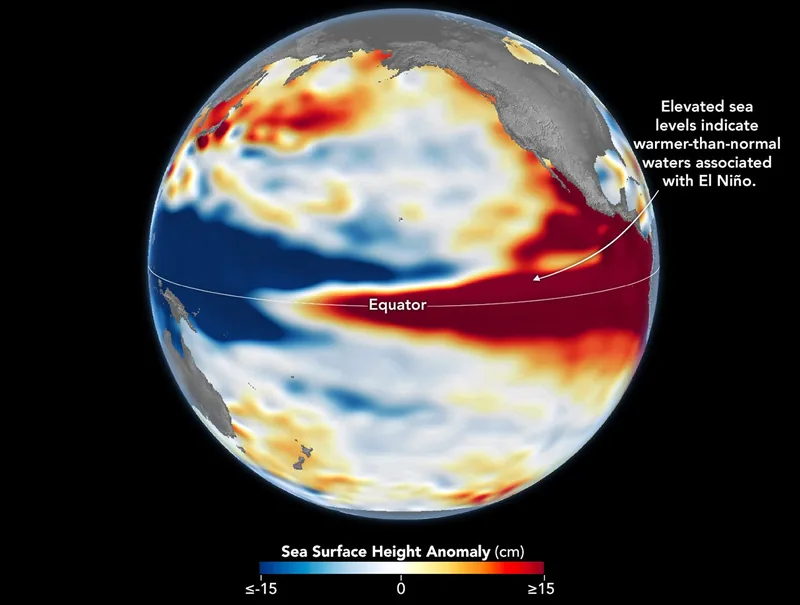
Two Pacific sea-level maps: October 1997 on the left and October 2026 on the right, both with higher-than-normal sea levels in the central and eastern equatorial Pacific.
Sea levels are higher than normal across the central and eastern equatorial Pacific in October 2026 (right), a hallmark of El Niño. The pattern closely resembles October 1997 (left), during another one of the strongest El Niño events in the satellite altimetry record. Maps by NASA Earth Observatory / Lauren Dauphin using altimetry data provided by NASA/JPL-Caltech. File credit dated 23 October 2026 on the upload. Satellite maps: NASA Earth Observatory / Lauren Dauphin, using NASA/JPL-Caltech altimetry · Public domain · NASA Earth Observatory / Lauren Dauphin / NASA/JPL-Caltech / Wikimedia Commons

This desk is not a forecast, and it is not a substitute for official CPC or Met Office outlooks. The next CPC discussion was scheduled for 10 December 2026. A WMO update as of mid-August 2026, paged 3 September 2026, is kept on its own card, dated, and is not treated as a silent rewrite of November. [source] Global temperature records live on climate-change.climates.im.
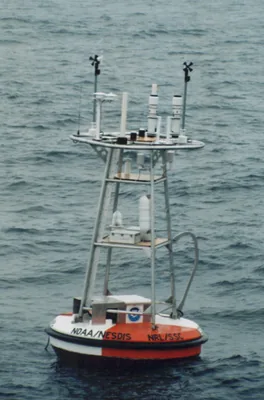
An ocean instrumentation buoy of the kind used by the Tropical Atmosphere Ocean project, afloat, photographed in September 1998.
A sample photograph of an ocean instrumentation buoy, typical of those used by the Tropical Atmosphere Ocean Project, by Nathan C. M. Franzen and Hugh Milburn, September 1998, from NOAA PMEL. The TAO array is how the equatorial Pacific is watched in place; current status figures on this site come from the CPC discussion, not from this still. Photo: Nathan C. M. Franzen and Hugh Milburn, NOAA PMEL · Public domain · NOAA PMEL / Nathan C. M. Franzen and Hugh Milburn / Wikimedia Commons

What the words mean — El Niño, La Niña, the Southern Oscillation, the historical Oceanic Niño Index, and the switch to the Relative Oceanic Niño Index under Public Information Statement 26-05 — is on the what it is page. Impacts are treated as chances, not as guarantees, around the world and for a UK winter.

Keep the lights on

Enjoyed a dated official advisory, unblended thresholds, and a careful look at chances rather than guarantees?

No pop-ups. No intrusive advertising. Just interesting stuff. A little support helps the next climates.im site get built.