Myths
Myths versus official wording
The surprising official fact is a change of index, and a historic-event chance that still comes with “not guaranteed.”
Each myth is answered with official wording, not with a blended average.
Myth: a very strong El Niño guarantees local impacts
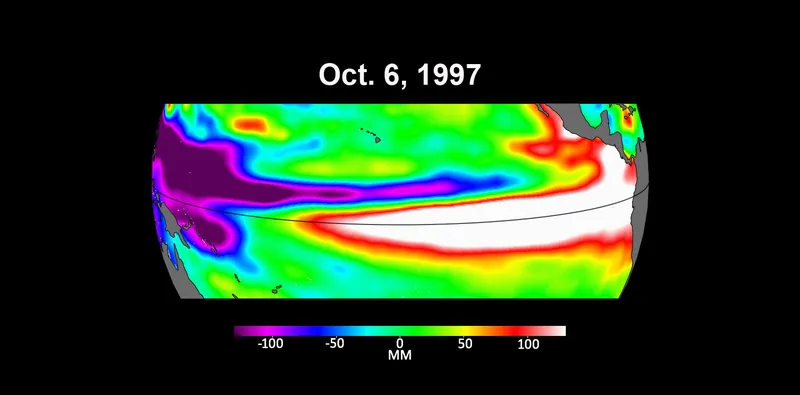
Fact: the 12 November 2026 CPC discussion says impacts consistent with El Niño are not guaranteed. [source] WMO: the strength of an event does not translate directly into the magnitude of impacts in any region. [source] The official RONI outlook: large values do not necessarily correspond with the strength of the influence or expected impacts. [source]
Myth: the official index is still the ONI, as everyone remembers it
Fact: per NWS Public Information Statement 26-05, RONI is used for official monitoring and prediction. The ONI v6 page remains as a historical series, and is no longer the official monitoring index. [source]
Myth: every official body uses the same “how long must 0.5 °C last” rule
Fact: CPC’s FAQ uses a 3-month onset rule. [source] The Met Office, as a guide, uses several months. [source] Historical ONI uses five consecutive overlapping seasons. [source] All three stay.
Myth: +2.5°C and +3.8°C are the same official number
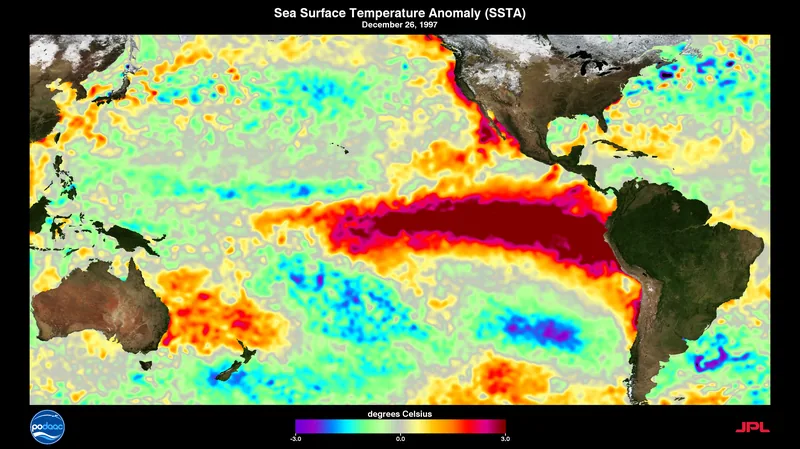
Fact: +2.5°C is CPC’s Niño-3.4 relative index in the 12 November 2026 discussion, a monthly figure. Approximately +3.8°C is a WMO ensemble-mean Niño 3.4 forecast for NDJ 2026–27, dated 21 October 2026. Different dates, different kinds of number.
Myth: an April 2025 “now ENSO-neutral” page is still the current status
Fact: Climate.gov pages opened on 18 November 2026 were archived as of 25 June 2025. Current official status is the CPC El Niño Advisory issued 12 November 2026.
Enjoyed a dated official advisory, unblended thresholds, and a careful look at chances rather than guarantees?
No pop-ups. No intrusive advertising. Just interesting stuff. A little support helps the next climates.im site get built.