Unusual official findings, and an archive that was not treated as current.
Public Information Statement 26-05 changed the official index. A 60% historic-event chance still comes with “not guaranteed.”
Some of the oddest official facts about El Niño are not the colour of a Pacific map. They are a change of official index, a “historic event” chance that is still not a guarantee, and two official numbers from two dates that must not be averaged.
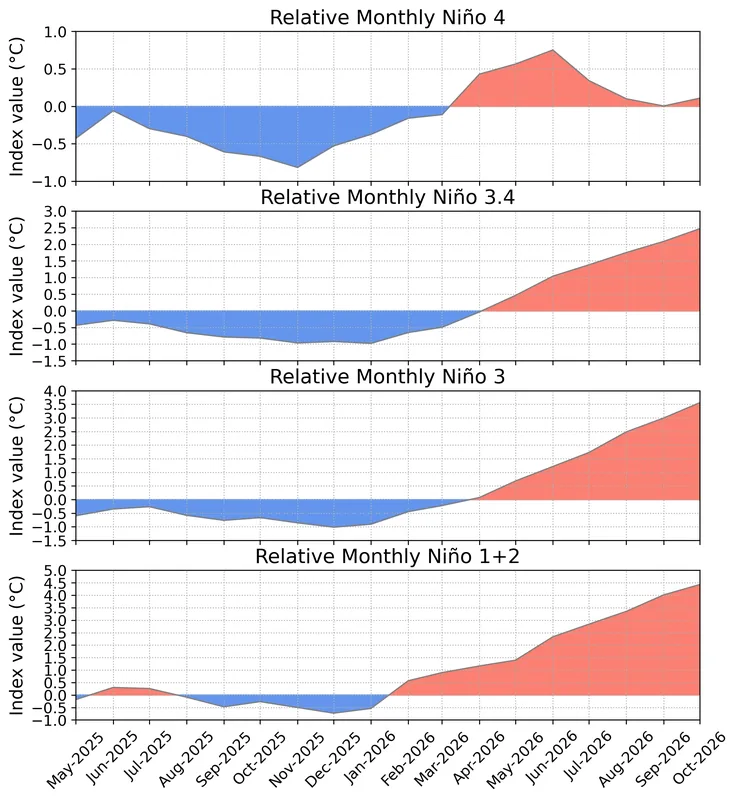
Figure 2 from the same 12 November 2026 discussion: time series of area-averaged relative SST anomalies (°C) in the Niño regions (Niño-4, Niño-3.4, Niño-3, Niño-1+2) minus the tropical mean (20°N–20°S). The relative indices are re-scaled to match the variance of traditional indices. Anomalies are departures from the 1991–2020 base period monthly means. Data: OISSTv2.1.Official chart: NOAA Climate Prediction Center / NCEP / NWS · Public domain (United States government work) · NOAA Climate Prediction Center / NCEP / National Weather Service
RONI takes over from ONI
The ONI v6 page still publishes the historical five-overlapping-seasons rule. The same page says that, per NWS Public Information Statement 26-05, the Relative Oceanic Niño Index is now used for official monitoring and prediction. [source] That switch is unusual official news, and it is easy to miss if a reader only remembers “the ONI.”
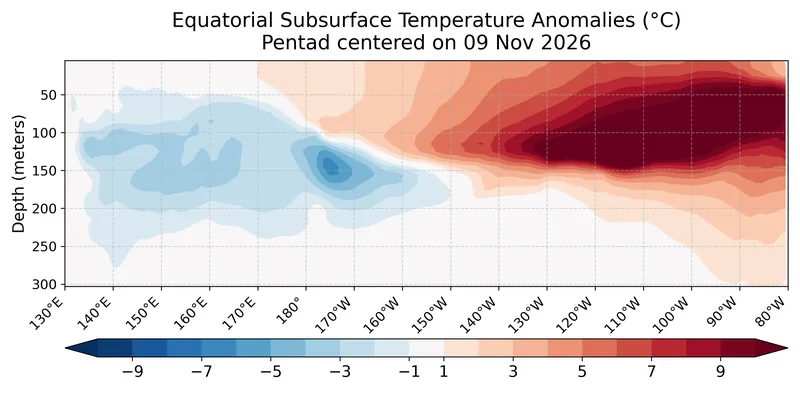
Figure 4 from the 12 November 2026 discussion: depth-longitude section of equatorial Pacific upper-ocean (0–300 m) temperature anomalies (°C) centered on the pentad of 4 November 2026. Anomalies are departures from the 1991–2020 base period pentad means. Data: GODAS.Official chart: NOAA Climate Prediction Center / NCEP / NWS · Public domain (United States government work) · NOAA Climate Prediction Center / NCEP / National Weather Service
A historic-event chance, and a not-guaranteed impact
The 12 November 2026 discussion gives about a 60% chance of a historic event exceeding previous El Niños dating back to 1950, defined as +2.5°C or more for a 3-month RONI value, in October-December and November-January, remaining at better than even odds. The same paragraph says impacts consistent with El Niño are not guaranteed. [source]
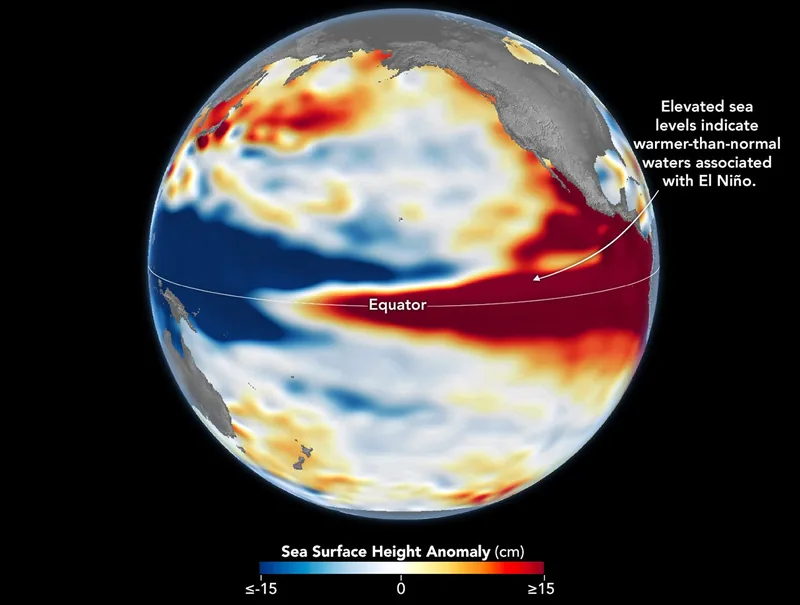
Sea levels are higher than normal across the central and eastern equatorial Pacific in October 2026 (right), a hallmark of El Niño. The pattern closely resembles October 1997 (left), during another one of the strongest El Niño events in the satellite altimetry record. Maps by NASA Earth Observatory / Lauren Dauphin using altimetry data provided by NASA/JPL-Caltech. File credit dated 23 October 2026 on the upload.Satellite maps: NASA Earth Observatory / Lauren Dauphin, using NASA/JPL-Caltech altimetry · Public domain · NASA Earth Observatory / Lauren Dauphin / NASA/JPL-Caltech / Wikimedia Commons
+2.5°C, and approximately +3.8°C
CPC’s +2.5°C is the Niño-3.4 relative index in the 12 November 2026 discussion, a monthly figure. [source] A WMO Global Seasonal Climate Update dated 21 October 2026 gave an ensemble-mean Niño 3.4 SST anomaly forecast of approximately +3.8°C for November-December-January 2026–27. Different dates, different kinds of number. They stay unblended.
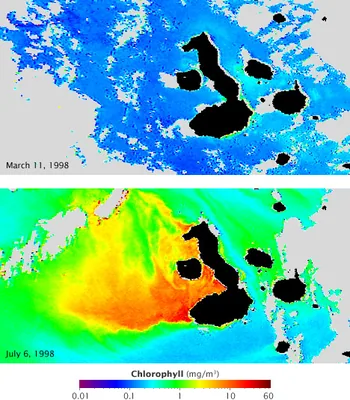
Chlorophyll concentration off the Galápagos archipelago during El Niño (top) and La Niña (lower), in a NASA Earth Observatory still dated 18 July 2009, from the GSFC Ocean Color team and GeoEye. Blue represents low concentrations; yellow, orange and red indicate high concentrations. The official caption: currents that normally fertilize the phytoplankton reverse during El Niño, resulting in barren oceans; those same currents are strengthened by La Niña, resulting in an explosion of ocean life.Satellite maps: GSFC Ocean Color team and GeoEye, NASA Earth Observatory · Public domain · NASA Earth Observatory / GSFC Ocean Color team and GeoEye / Wikimedia Commons
An archived page that is not current status
Climate.gov pages opened on 18 November 2026 were an archived snapshot as of 25 June 2025, still showing an April 2025 Final La Niña Advisory and ENSO-neutral. Using that archive as if it were this November’s status would have been the easy mistake. It is not used that way.
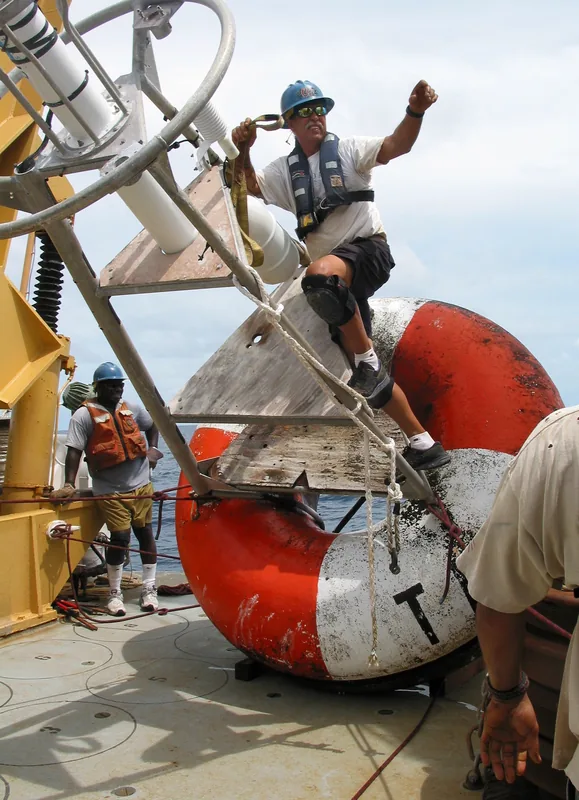
NOAA Ship Ka’imimoana, Chief Bosun Roger Stone reaches for the crane hook so that the recovered TAO buoy can be moved off the fantail. Pacific Ocean, equatorial region, 0°, 180°W, December 2003. Photograph by Linda Stratton, OAR/PMEL, NOAA Photo Library ship1261.Photo: Linda Stratton, NOAA OAR/PMEL · Public domain · NOAA Photo Library / Linda Stratton, OAR/PMEL / Wikimedia Commons
Three ways to last 0.5 °C
CPC’s FAQ: a 3-month average, onset. [source] The Met Office: about 0.5 °C for several months, as a guide. [source] Historical ONI: five consecutive overlapping seasons. [source] The discovery is that all three were opened.
Keep the lights on
Enjoyed a dated official advisory, unblended thresholds, and a careful look at chances rather than guarantees?
No pop-ups. No intrusive advertising. Just interesting stuff. A little support helps the next climates.im site get built.