Explore climates.im

Play

A quiz and a timeline

A quiz drawn from official wording, and a timeline of official dates, with a short game that asks you to put five years in order.
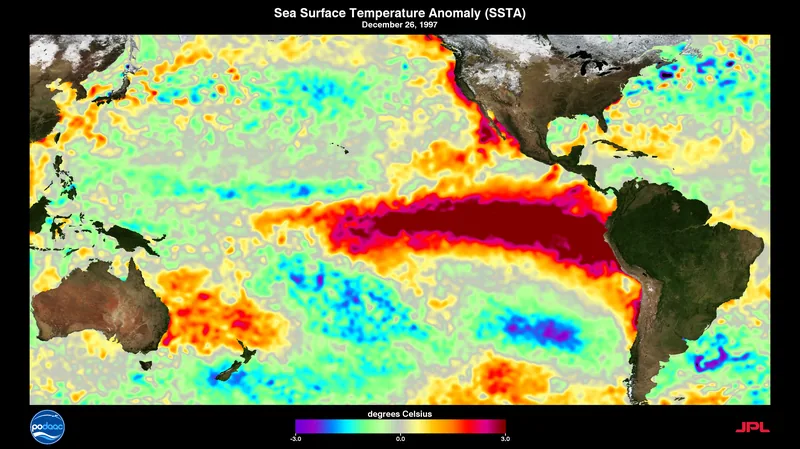
A visualization of Pacific sea-surface temperatures during the 1997–1998 El Niño.
A visualization of sea-surface temperatures during the 1997–1998 El Niño, from NASA Goddard Scientific Visualization Studio (SVS 30551), file dated 19 November 2014, by Charles Thompson. A historical visualization; it is not a substitute for the October 2026 CPC relative-SST map. Visualization: Charles Thompson, NASA SVS (GSFC) · Public domain · NASA SVS / Charles Thompson / Wikimedia Commons

The quiz will not ask you to average +2.5°C with +3.8°C, or to treat an archived April 2025 page as this November’s status.

Keep the lights on

Enjoyed a dated official advisory, unblended thresholds, and a careful look at chances rather than guarantees?

No pop-ups. No intrusive advertising. Just interesting stuff. A little support helps the next climates.im site get built.