Credits
Every photograph on this site
Licences were checked on each source page on 18 November 2026. The current-status maps are official NOAA Climate Prediction Center figures from the 12 November 2026 discussion (United States government work, public domain). Historical stills are public-domain photographs and maps from NOAA, NASA Earth Observatory, NASA/JPL-Caltech, NASA SVS, and NOAA PMEL.
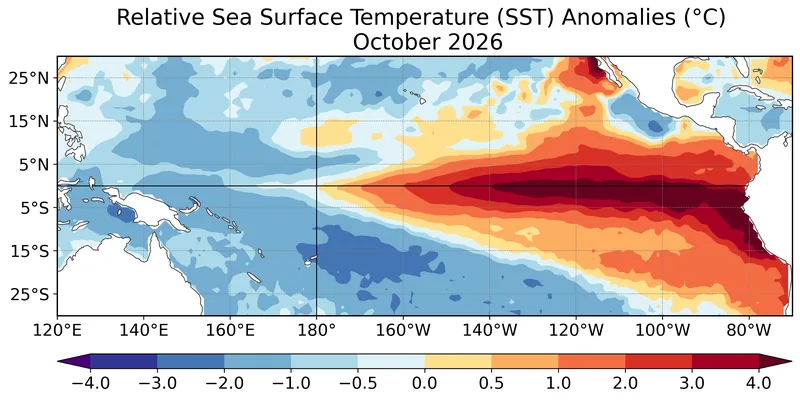
Figure 1 from the CPC/NCEP/NWS ENSO Diagnostic Discussion issued 12 November 2026: average relative sea surface temperature (SST) anomalies (°C) for October 2026, computed with respect to the 1991–2020 base period monthly means. Data: OISSTv2.1. Official map: NOAA Climate Prediction Center / NCEP / NWS · Public domain (United States government work) · NOAA Climate Prediction Center / NCEP / National Weather Service 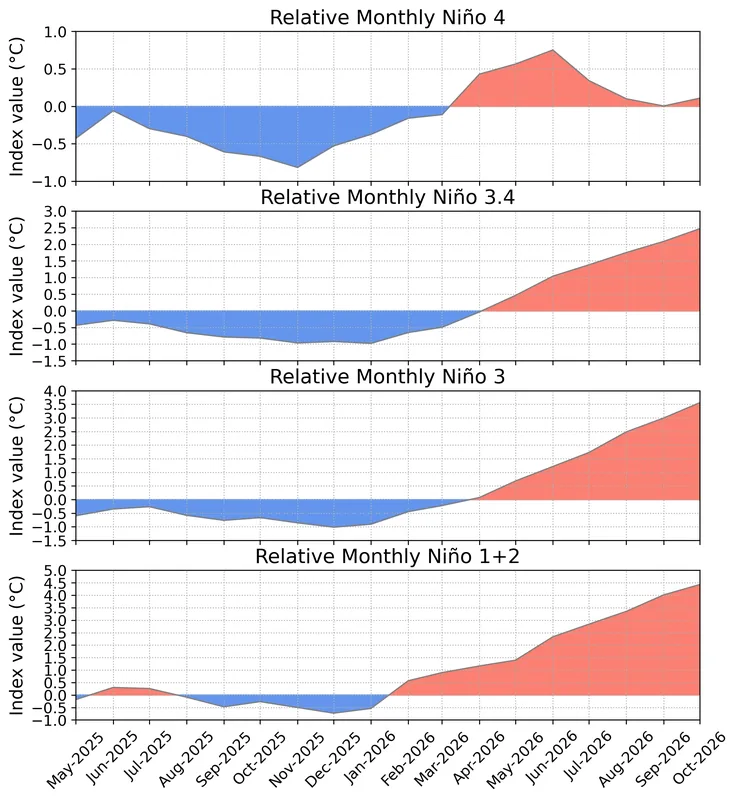
Figure 2 from the same 12 November 2026 discussion: time series of area-averaged relative SST anomalies (°C) in the Niño regions (Niño-4, Niño-3.4, Niño-3, Niño-1+2) minus the tropical mean (20°N–20°S). The relative indices are re-scaled to match the variance of traditional indices. Anomalies are departures from the 1991–2020 base period monthly means. Data: OISSTv2.1. Official chart: NOAA Climate Prediction Center / NCEP / NWS · Public domain (United States government work) · NOAA Climate Prediction Center / NCEP / National Weather Service 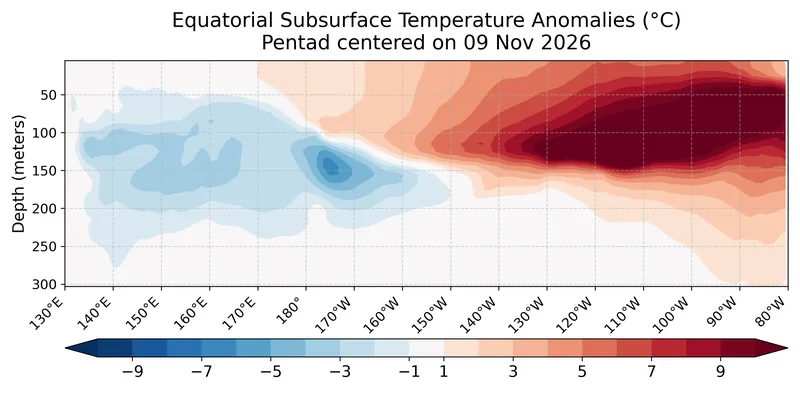
Figure 4 from the 12 November 2026 discussion: depth-longitude section of equatorial Pacific upper-ocean (0–300 m) temperature anomalies (°C) centered on the pentad of 4 November 2026. Anomalies are departures from the 1991–2020 base period pentad means. Data: GODAS. Official chart: NOAA Climate Prediction Center / NCEP / NWS · Public domain (United States government work) · NOAA Climate Prediction Center / NCEP / National Weather Service 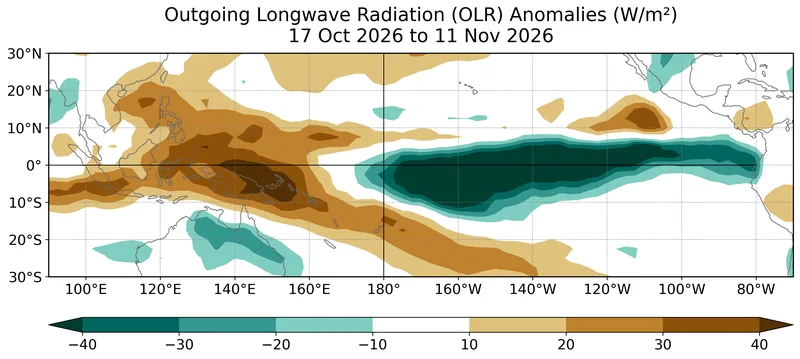
Figure 5 from the 12 November 2026 discussion: average outgoing longwave radiation (OLR) anomalies (W/m²) for 12 October to 6 November 2026, computed as departures from the 1991–2020 base period pentad means. Data: CBOv1. Enhanced convection and rainfall, the discussion says, remained from the central to the eastern Pacific, with suppressed conditions over Indonesia. Official map: NOAA Climate Prediction Center / NCEP / NWS · Public domain (United States government work) · NOAA Climate Prediction Center / NCEP / National Weather Service 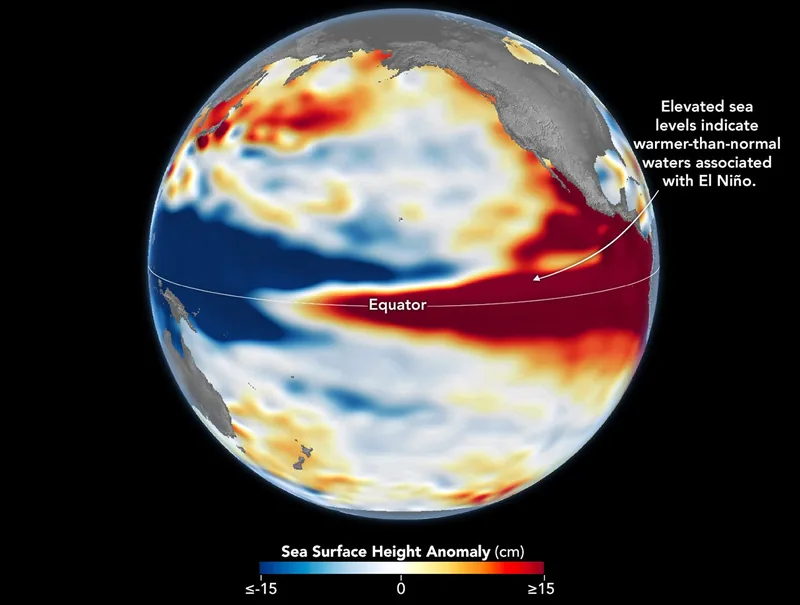
Sea levels are higher than normal across the central and eastern equatorial Pacific in October 2026 (right), a hallmark of El Niño. The pattern closely resembles October 1997 (left), during another one of the strongest El Niño events in the satellite altimetry record. Maps by NASA Earth Observatory / Lauren Dauphin using altimetry data provided by NASA/JPL-Caltech. File credit dated 23 October 2026 on the upload. Satellite maps: NASA Earth Observatory / Lauren Dauphin, using NASA/JPL-Caltech altimetry · Public domain · NASA Earth Observatory / Lauren Dauphin / NASA/JPL-Caltech / Wikimedia Commons 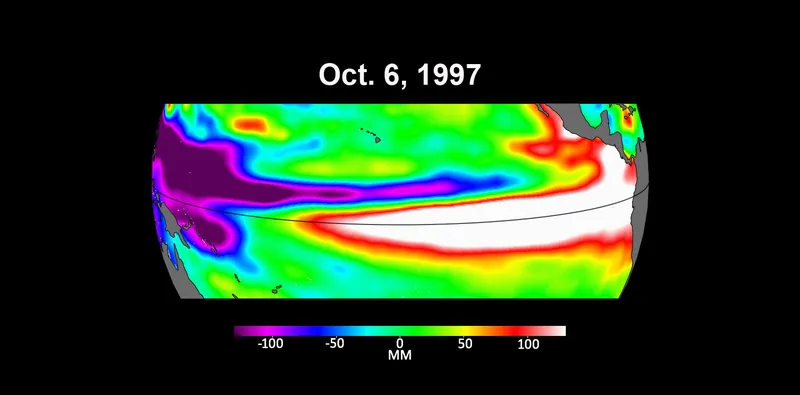
Three maps based on satellite data show sea levels in the Pacific Ocean during developing El Niño events in early October of 1997, 2015 and 2023 (NASA Photo ID PIA26099, taken 18 October 2023). Higher-than-average ocean heights are shown in red and white, lower-than-average in blue and purple. The official caption says the two earlier maps represent the two extreme El Niño events from the past 30 years, 1997–1998 and 2015–2016, and that El Niños are characterized by higher-than-normal sea levels and warmer-than-average ocean temperatures along the equatorial Pacific, because water expands as it warms. Satellite maps: NASA Jet Propulsion Laboratory / NASA/JPL-Caltech · Public domain · NASA/JPL-Caltech / Wikimedia Commons 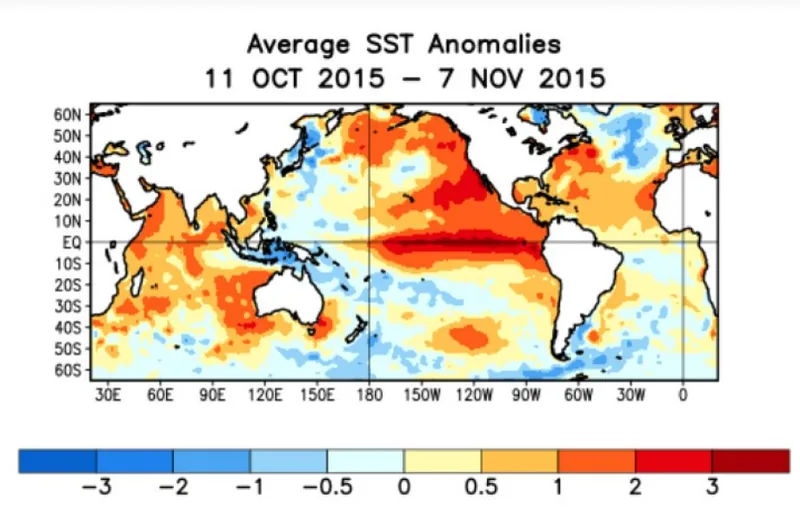
SST anomalies averaged for 11 October 2015 to 7 November 2015, during the 2015–2016 El Niño event, from daily, weekly and monthly NOAA Optimum Interpolation (OI) Version 2 SST data. The file description says sea-surface temperature is the temperature of the top millimetre of the ocean’s surface, and that these maps compare a given month to the long-term average of that month from 1985 through 1997. A historical still; current status is the 12 November 2026 CPC discussion. Official map: NOAA · Public domain · NOAA / Wikimedia Commons 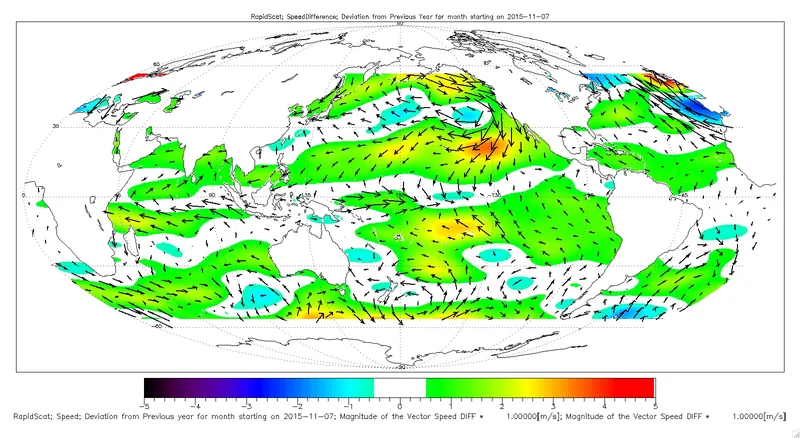
Ocean winds near the surface as observed by NASA’s ISS-RapidScat on the International Space Station, for November 2015 (PIA20365). The official caption says El Niño events are most easily visible in sea-surface temperature, sea-surface height and near-surface ocean winds, and that the precursor and main driver is a weakening of the normally westward trade winds, or even their reversal, in the western and central tropical Pacific. ISS-RapidScat launched on 21 September 2014. Satellite map: NASA/JPL-Caltech, ISS-RapidScat · Public domain · NASA/JPL-Caltech / Wikimedia Commons 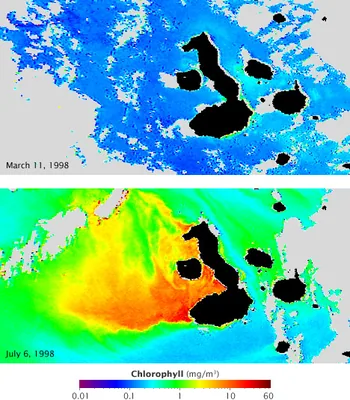
Chlorophyll concentration off the Galápagos archipelago during El Niño (top) and La Niña (lower), in a NASA Earth Observatory still dated 18 July 2009, from the GSFC Ocean Color team and GeoEye. Blue represents low concentrations; yellow, orange and red indicate high concentrations. The official caption: currents that normally fertilize the phytoplankton reverse during El Niño, resulting in barren oceans; those same currents are strengthened by La Niña, resulting in an explosion of ocean life. Satellite maps: GSFC Ocean Color team and GeoEye, NASA Earth Observatory · Public domain · NASA Earth Observatory / GSFC Ocean Color team and GeoEye / Wikimedia Commons 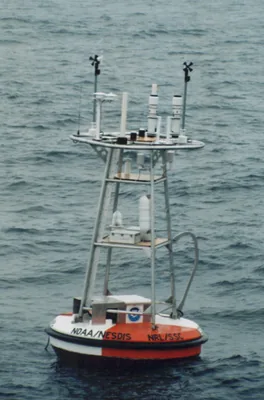
A sample photograph of an ocean instrumentation buoy, typical of those used by the Tropical Atmosphere Ocean Project, by Nathan C. M. Franzen and Hugh Milburn, September 1998, from NOAA PMEL. The TAO array is how the equatorial Pacific is watched in place; current status figures on this site come from the CPC discussion, not from this still. Photo: Nathan C. M. Franzen and Hugh Milburn, NOAA PMEL · Public domain · NOAA PMEL / Nathan C. M. Franzen and Hugh Milburn / Wikimedia Commons 
NOAA Ship Ka’imimoana, Chief Bosun Roger Stone reaches for the crane hook so that the recovered TAO buoy can be moved off the fantail. Pacific Ocean, equatorial region, 0°, 180°W, December 2003. Photograph by Linda Stratton, OAR/PMEL, NOAA Photo Library ship1261. Photo: Linda Stratton, NOAA OAR/PMEL · Public domain · NOAA Photo Library / Linda Stratton, OAR/PMEL / Wikimedia Commons 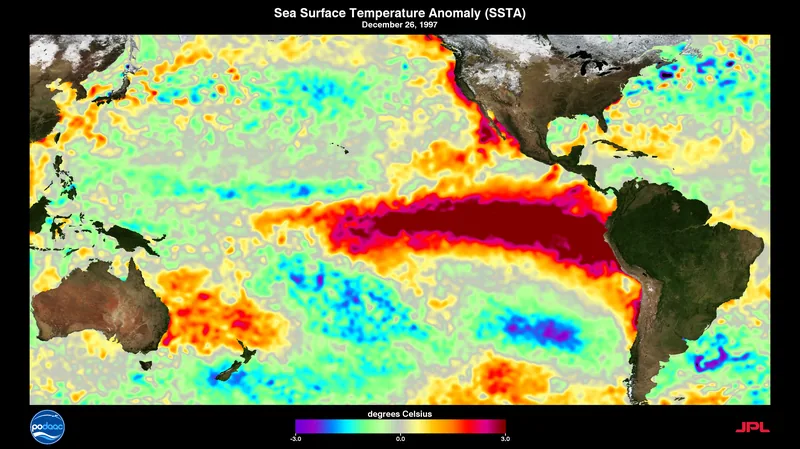
A visualization of sea-surface temperatures during the 1997–1998 El Niño, from NASA Goddard Scientific Visualization Studio (SVS 30551), file dated 19 November 2014, by Charles Thompson. A historical visualization; it is not a substitute for the October 2026 CPC relative-SST map. Visualization: Charles Thompson, NASA SVS (GSFC) · Public domain · NASA SVS / Charles Thompson / Wikimedia Commons
Enjoyed a dated official advisory, unblended thresholds, and a careful look at chances rather than guarantees?
No pop-ups. No intrusive advertising. Just interesting stuff. A little support helps the next climates.im site get built.