Explore climates.im

Around the world

Around the world, as chances

A strong event is not, in official wording, a direct translation into the size of the impacts.
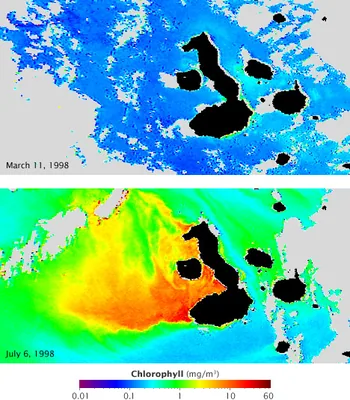
Two maps of chlorophyll concentration around the Galápagos, one during El Niño and one during La Niña.
Chlorophyll concentration off the Galápagos archipelago during El Niño (top) and La Niña (lower), in a NASA Earth Observatory still dated 18 July 2009, from the GSFC Ocean Color team and GeoEye. Blue represents low concentrations; yellow, orange and red indicate high concentrations. The official caption: currents that normally fertilize the phytoplankton reverse during El Niño, resulting in barren oceans; those same currents are strengthened by La Niña, resulting in an explosion of ocean life. Satellite maps: GSFC Ocean Color team and GeoEye, NASA Earth Observatory · Public domain · NASA Earth Observatory / GSFC Ocean Color team and GeoEye / Wikimedia Commons

Official pages are careful about the difference between a strong event and a guaranteed local impact. The 12 November 2026 CPC discussion says that even with a very strong El Niño, the chances of experiencing impacts consistent with El Niño are higher, though not guaranteed. [source] The WMO’s mid-August 2026 update says the strength of an El Niño event does not translate directly into the magnitude of impacts in any region. [source] The official RONI outlook repeats a similar caution about large index values. [source]
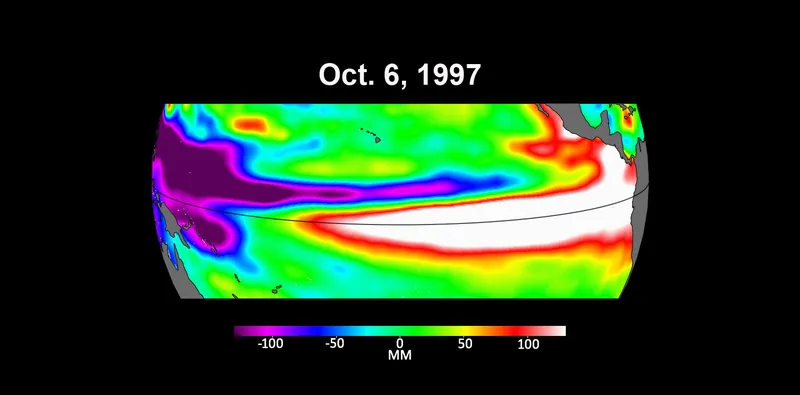
Three Pacific sea-level maps from early October of 1997, 2015 and 2023, with higher-than-average heights in red and white along the equator.
Three maps based on satellite data show sea levels in the Pacific Ocean during developing El Niño events in early October of 1997, 2015 and 2023 (NASA Photo ID PIA26099, taken 18 October 2023). Higher-than-average ocean heights are shown in red and white, lower-than-average in blue and purple. The official caption says the two earlier maps represent the two extreme El Niño events from the past 30 years, 1997–1998 and 2015–2016, and that El Niños are characterized by higher-than-normal sea levels and warmer-than-average ocean temperatures along the equatorial Pacific, because water expands as it warms. Satellite maps: NASA Jet Propulsion Laboratory / NASA/JPL-Caltech · Public domain · NASA/JPL-Caltech / Wikimedia Commons

Chances the Met Office names

The Met Office climate-drivers page, on global impacts, gives increased risks of floods in Peru and droughts in Indonesia, India and parts of Brazil during El Niño. El Niño can push up global temperatures, and El Niño years are often among the hottest; the temperature record itself stays on climate-change.climates.im. [source] During La Niña, parts of Australia, Indonesia and equatorial South America are typically wetter, and the southern USA often has drought. El Niño is thought to limit North Atlantic tropical storms; La Niña can enhance them. [source]
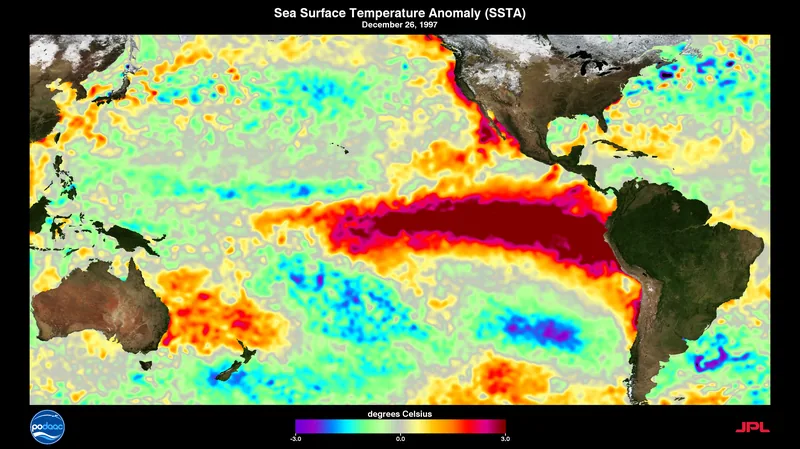
A visualization of Pacific sea-surface temperatures during the 1997–1998 El Niño.
A visualization of sea-surface temperatures during the 1997–1998 El Niño, from NASA Goddard Scientific Visualization Studio (SVS 30551), file dated 19 November 2014, by Charles Thompson. A historical visualization; it is not a substitute for the October 2026 CPC relative-SST map. Visualization: Charles Thompson, NASA SVS (GSFC) · Public domain · NASA SVS / Charles Thompson / Wikimedia Commons

A NASA Earth Observatory still of chlorophyll around the Galápagos, dated 18 July 2009, describes a different kind of impact: currents that normally fertilize phytoplankton reverse during El Niño, resulting in barren oceans, and are strengthened by La Niña. That is the file’s official caption, not a new CPC forecast.

UK wording has its own page, because a UK winter is a chance, not a promise.

Keep the lights on

Enjoyed a dated official advisory, unblended thresholds, and a careful look at chances rather than guarantees?

No pop-ups. No intrusive advertising. Just interesting stuff. A little support helps the next climates.im site get built.